NZ Financial Resets: Part 1: Introduction
This multi-generation crime story will show how the New Zealand Government has facilitated and been complicit in the theft of the nation's, yours, and your forebears' wealth for over a century.
“There are two different ways of writing history: one is to persuade men to virtue and the other is to compel men to truth” ― Robert Graves, I, Claudius: from the Autobiography of Tiberius Claudius
Next: Gold Confiscation
Home: New Zealand’s Financial Resets
New Zealand’s Financial Resets
PART 1: Introduction
Dollar in Decline
The next ‘great taking’ is reaching its climax. As the New Zealand dollar (NZD) undergoes its final debasement,1 and the ‘end of the end’ printing orgy which began in 2010 concludes,2 it is timely to look at New Zealand’s legal tender currency history in the context of the government’s facilitation of, and complicity in, the theft of money (i.e. gold and silver), of purchasing power of the currency, and peoples’ savings3 for 110 years.
56 years since its 1967 introduction the NZD has reached the point where it is almost worthless. In the first decade of its existence the NZD lost in the order of 40-50% of its purchasing power, depending on the good or service. Today (Q1 2024), the NZD has lost over 95% of its original purchasing power. Two examples are enough to show this pattern. Milk and housing.4
Year : Milk (Litres per $) : % loss of purchasing power
1967 : 10-12
1977 : 6-7 : (10-6)/10=0.4 = 40%
2024 : 0.3 : 97
Year : Home (house/$) : % loss of purchasing power
1967 : 1/13000
1977 : 1/25000 : 48
2024 : 1/600000 : 98
The NZD lost around 40% purchasing power for milk and 48% for homes in the first decade of its existence. By January 2024 this became 97% and 98% respectively. This price inflation, really a theft, is a consequence of the real inflation, to the money supply, represented by the M1 and M3 money supply measures.5 The pattern is clear.
Everyone now feels this final debasement with consumer price inflation rampant. The official consumer price index (CPI) inflation numbers are nonsense of course; anecdotally consumer price inflation is at least twice the official ‘core’ inflation number of just over 5%, after peaking at 6.7% in early 2023. ‘Core’ inflation excludes food and energy, among the categories currently experiencing the highest rates of price increases.6
Government facilitated currency debasement in New Zealand has been occurring in one form or another since at least 1914. Today, with a pure debt based fiat currency created out of thin air, the debasement is called inflation and normalized. In the past, the people who decide these things had to be bolder and more obvious in their theft. Debasement generally required reducing the precious metal content of gold and silver coins used as legal tender (known as specie). Another form of debasement is making the paper notes (i.e. banknotes), used as claims for specie, legal tender. It’s then possible to inflate the money supply without increasing the precious metal backing it.7
Financial Resets
Globally, significant changes to financial systems happen under the cover of war, financial extremity or some other crisis. New Zealand is no different. The years identified above for financial resets are: WW1 start (1914), WW1 end + 2 years (1920), worldwide economic depression (1933), WW2 (1944), WW2 end + 2 years (1947), Vietnam war (1967 and 1971). Each time one of these resets occurred, citizens had wealth stolen by stealth (and I don’t mean taxation; that’s not taken by stealth), facilitated by the state. Legislation passed during periods of financial and social extremity has been used to facilitate what today might be called the various financial resets. This has been going on for 110 years.
Next: Gold Confiscation
Home: New Zealand’s Financial Resets
Loss of value. So with precious metal coin debasement is reducing the precious metal content. In the case of a debt based fiat currency system like New Zealand’s, debasement is the increase in the money supply by the creation of more debt.
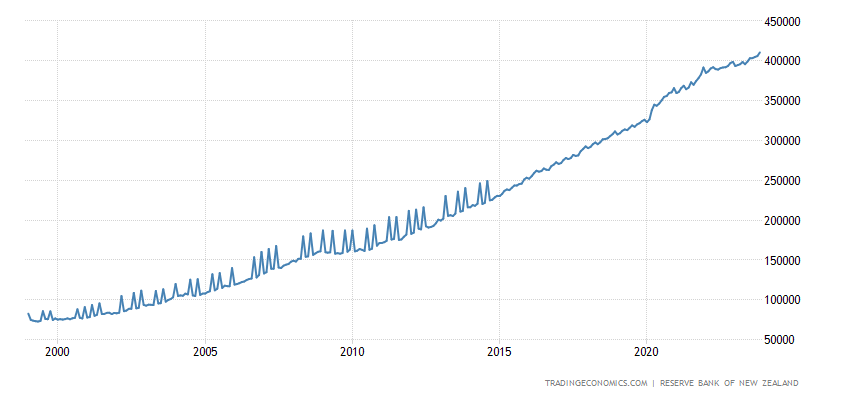
The ‘beginning of the end’ was 2010 when both the M1 & M3 money supply measures, after a post-2008 global financial crisis pause, began growing again at the same or faster rate than pre-2008.
New Zealand Money Supply M1 (NZD Million)
https://tradingeconomics.com/new-zealand/money-supply-m1
The ~NZD140B to ~NZD120B decline (~%14) in M1 money in the two years from January 2022 is the first time in history M1 has decreased for more than brief period, and previous declines were relatively negligible compared to today.
New Zealand Money Supply M3 (NZD Million)
https://tradingeconomics.com/new-zealand/money-supply-m3
Philosophically this is theft of property, a person’s time and economic energy. Currency is accepted for settlement of a transaction debt (including payment for an individual’s energy and time i.e. wages/salary) because it:
is required to pay government taxes, backed by the coercive force of the state; this is the fundamental reason why today’s pure debt based fiat currency is accepted, as it has no intrinsic value
can be readily converted into goods and services today
can be used to store the value of today’s energy expenditure for future conversion into real goods and services. This is impossible when the currency is fiat and created by debt.
Prices from https://paperspast.natlib.govt.nz/. The milk price was regulated and subsidized until 1985, with little variation nationwide. Home prices varied widely depending on location, style, land area etc. For this example a new (built within three years) 3 bedroom house on a quarter acre section in Christchurch is used.
All prices are in X per $ (‘X’ being the purchased item) instead of $ per X, so direct purchasing power comparisons can be made. For example 5 cents per pint (=0.6 litre) milk in 1967 becomes 0.6 L/0.05$ = 12 L/$
[Addendum: 25 Sept. 2024: Gold (g) per NZD since 1 Jan. 1968. Source.]
Since 1 Jan. 2000
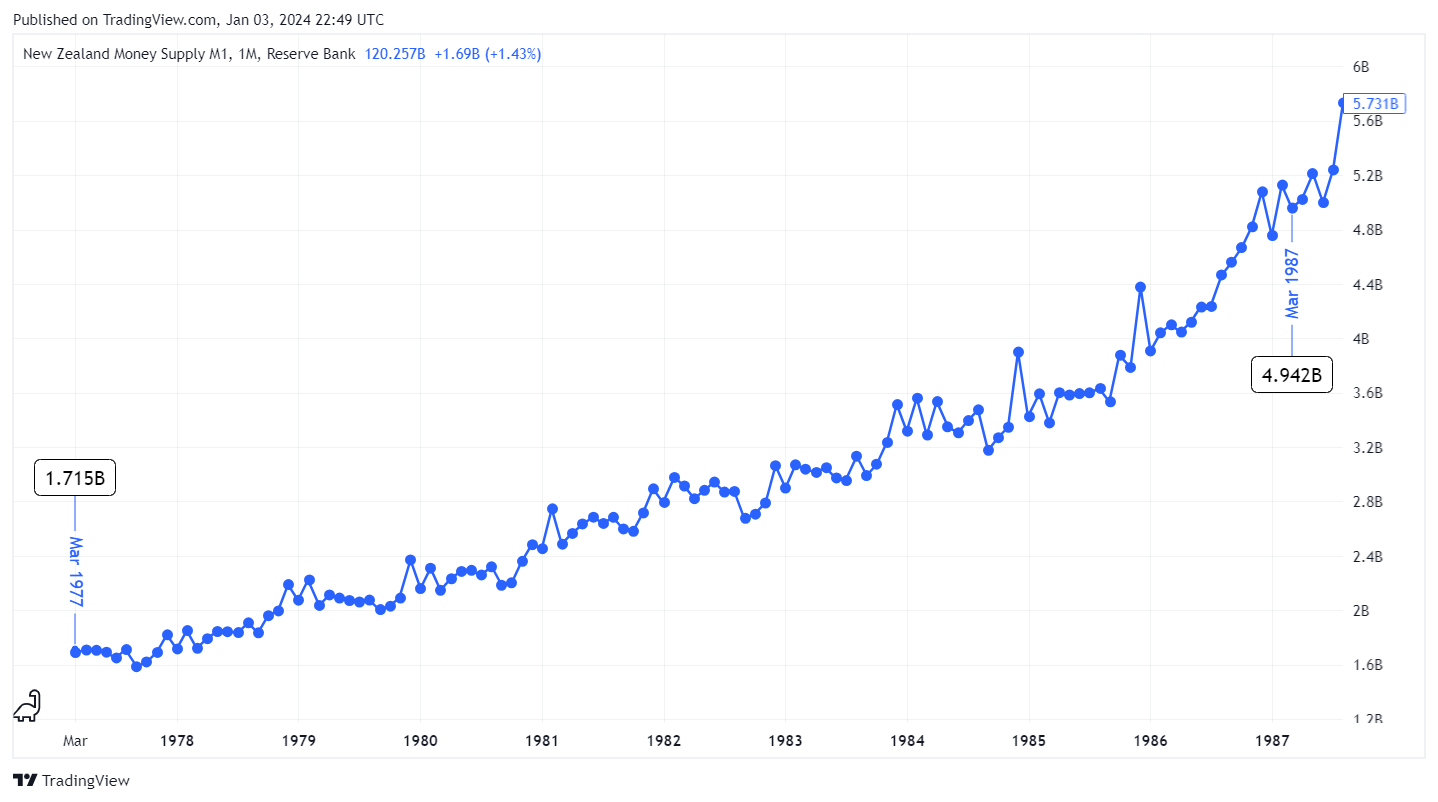
New Zealand M1 and M3 Money Supply 1977-1987. This shows the second 10 years of the NZD, but it shows the same pattern. In 1967 there were zero NZDs, M1 or M3. By 1977 there were NZD1.7B and NZD6.6B respectively. Milk prices are part of M1 because it’s a cash purchase. House prices come under M3 because debt is normally used as the purchase mechanism.
Reserve Bank of New Zealand Financial Stability Report, November 2023, pg 4.
https://www.rbnz.govt.nz/-/media/project/sites/rbnz/files/publications/financial-stability-reports/2023/nov-2023/fsr-nov-23.pdf
See also:
The Reserve Bank Grift #5: Lies, Damn Lies, and Core Inflation
One way to lie with statistics: Headline inflation, Trimmed mean inflation, Weighted median, Sectoral factor model, Core factor inflation. None of them actual consumer price inflation or money supply inflation.
From: Why Marx Loved Central Banks, Mises Institute, Thorsten Polleit (2019)
https://mises.org/wire/why-marx-loved-central-banks
“The idea of central banking has a long history. For instance, the Swedish central bank, the Sveriges Riksbank, was founded in 1668, and the English central bank, the Bank of England, was formed in 1694. The fraudulent operations of such institutions came to light soon, at the latest with the writing of the British economist David Ricardo. In his 1809 essay “The High Price of Bullion” he pointed out that it was the increase in the quantity of money — in the form of banknotes not backed by gold — that caused a general rise in prices, an effect we know as (price) inflation.”


Very red pilling writing.
Crooks n thieves. It's so complicated too, no wonder they get away with it!